14/09/15
Lesson 3-Calculating and illustrating market equilibrium using linear demand/supply functions
Learning Objective: I can calculate market price and quantity using linear demand and supply functions.
DA:
Using the demand/supply function we are able to do the following:
DA:
Using the demand/supply function we are able to do the following:
- Derive the demand/supply schedule.
- Calculate the equilibrium price/quantity demanded/supplied.
- Illustrate schedules on a graph.
|
Don't forget!
Qd= a - bP
|
Don't forget!
Qs= c + dP
|
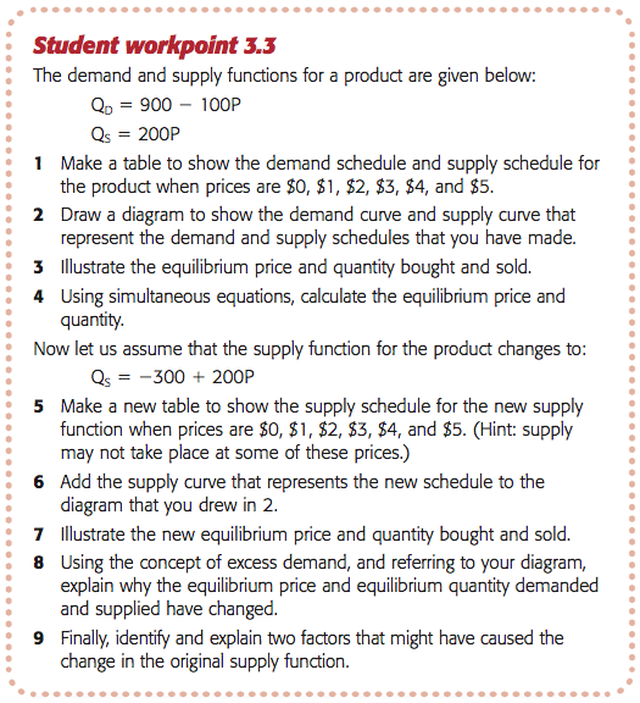
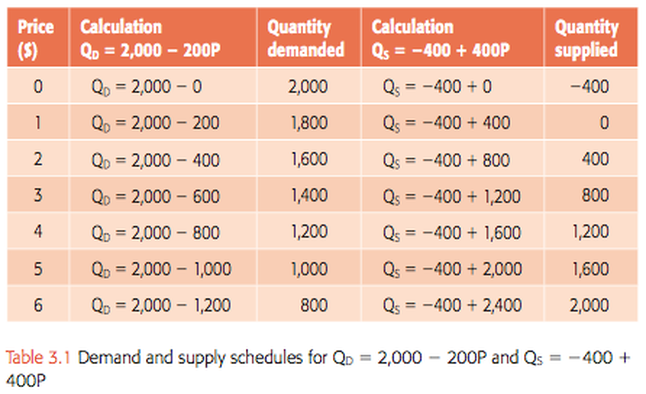
Qd= 2000 - 200p
Qs= -400 + 400p
Qs= -400 + 400p
|
|
Plot the relevant demand/supply curves:
|
Equilibrium can also be found by setting our two functions opposite each other:
|
Once we have the equilibrium price, equilibrium quantity can be found by substituting the price into either the demand function or the supply function:
|
|
Equilibrium Qd=Qs
2000 - 200P = -400 + 400P Simplify equation and solve for P |
Qd= 2000 - 200P
Qd= 2000 - (200 x 4) Qd= 2000 - 800 = 1200 units |
Qs= -400 + 400P
Qs= -400 + (400 x 4) Qs= -400 + 1600 = 1200 units |
|
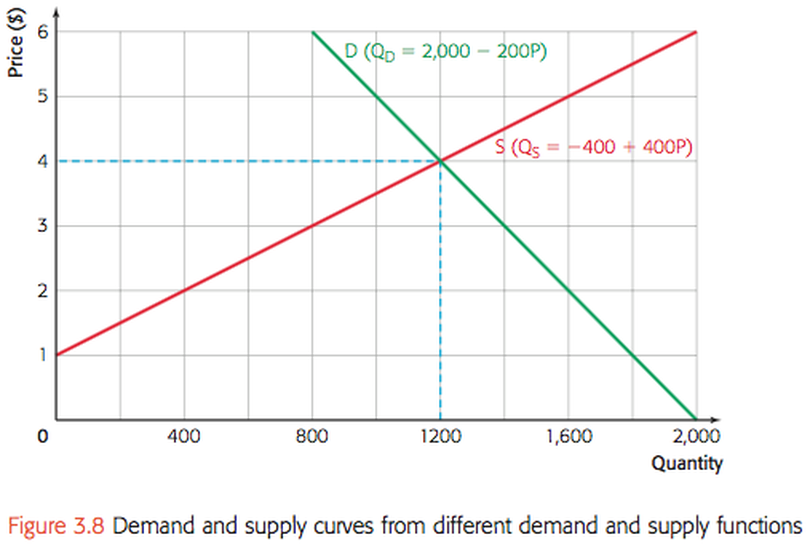
Using demand/supply functions we may show effects of changes in the determinants of demand/supply. Let's assume there is a shift of demand curve to the left, caused by a changed in tastes of the product. Qd= 1400 - 200P 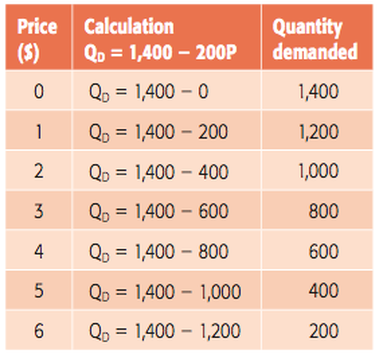
|
Demand curve has shifted left, with 600 fewer units being demanded at each price. Excess supply at 600, prices falls to eliminate excess. 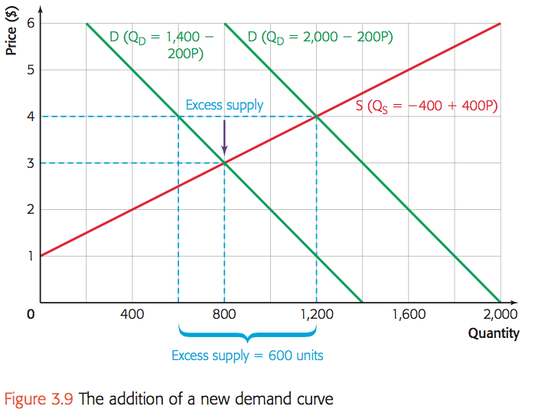
|
Activity/HW: